R Colors
In this article, you will learn different r color palettes and different ways to set them.
Choosing an appropriate color combination in the data analysis and graphics is considered one of the most important part. Color plays a vitally important role in the web world. In this article, we discover more about how color can help you to create more interactive plots.
Generally, we use number in plot for set of colors, these are the default colors range from 0 to 12.
image(1:12, 1, as.matrix(1:12), col = 0:11, main = "Default 9 Colors",
+ ylab = "", xlab = "", yaxt = "n")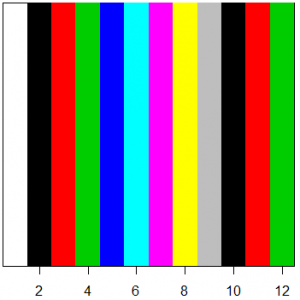
Except these default range, r supports more than 650 colors. That list contains on color() vector.
The length() function returns the length of colors in r.
> length(colors())
[1] 657
Here, you can see the variations.
colors()[1:10]
 [1] "white"         "aliceblue"     "antiquewhite"  "antiquewhite1"
 [5] "antiquewhite2" "antiquewhite3" "antiquewhite4" "aquamarine"
 [9] "aquamarine1"   "aquamarine2"
R also has complementing and contrasting color palettes predefined in R rainbow, terrain,
heat, topo, cm, gray, which we can see in these examples –
R rainbow colors
It creates a vector of colors in a rainbow pattern.
barplot(1:12, col=rainbow(12))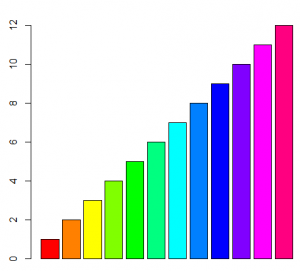
R terrain colors
barplot(1:12, col=terrain.colors(12, alpha = 1))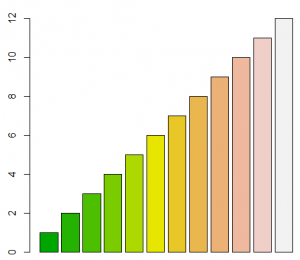
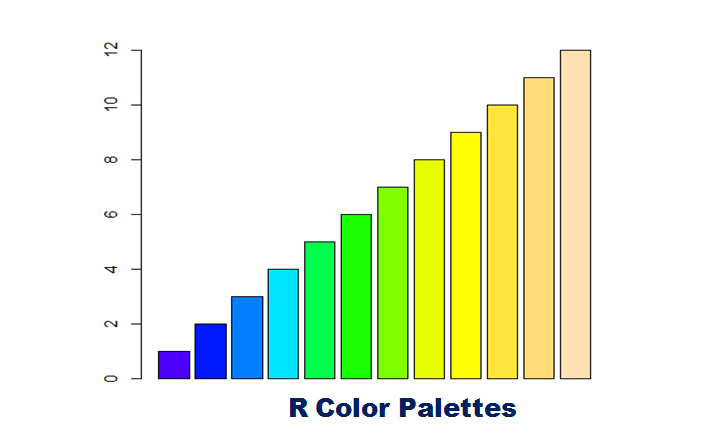
R topo colors
barplot(1:12, col=topo.colors(12, alpha = 1))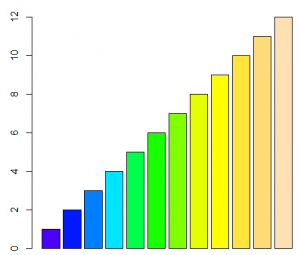
R heat colors
It creates a vector of red-to-yellow colors.
barplot(1:12, col=heat.colors(12, alpha = 1))
R cm colors
barplot(1:12, col=cm.colors(12, alpha = 1))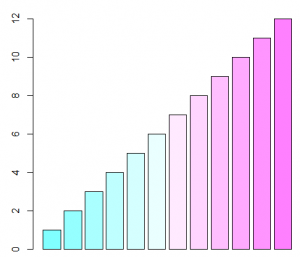


Hi! This is my first visit to your blog! We are a group of volunteers and starting a new project in a community in the same niche. Your blog provided us useful information to work on. You have done a outstanding job!| а
Greetings! Very helpful advice in this particular article!
It is the little changes that will make the greatest changes.
Many thanks for sharing!