R Box Plots
Boxplot is a visual representation of data that shows the minimum, first quartile, median, third quartile and maximum in the graph. The median is a line that divides the box into two parts. In R, we can generate box plots of a single or multiple element vector using boxplot() function.
Syntax of Boxplot
boxplot(x, data, col, xlab, ylab, main, notch, varwidth)x - x is a formula.
data - data is the data to plot on graph.
xlab and ylab - xlab and ylab are the levels for x and y axis respectively.
notch - notch is a boolean value, it draw a notch if set to true.
col - col attribute is used to set color.
main - main attribute is to give a title to the graph.
varwidth - 'varwidth=TRUE' makes boxplot width proportional to the square root of the samples sizes.
horizontal - 'horizontal=TRUE' reverse the axis orientation.
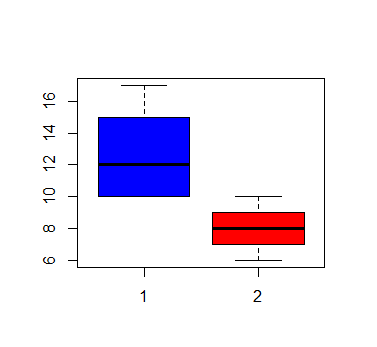
Example of R Box Plots
In the example below, we generate a box plot of two vectors and also set box colors.
students <- c(10, 15, 10, 17, 12)
marks <- c(9, 7, 8, 6, 10)
boxplot(students, marks, col <- c('blue', 'red'))
The above code generates this graph.